Get predictive insight into your ADC’s stability with these 3 experiments

When developing ADCs, there are some strategies for protein assessment that will help mitigate the risk of destabilizing the final product during early development, particularly when optimizing the conjugation process itself.
In this blog, the focus is on predictive stability experiments. Learn how it’s possible to use the Prometheus Panta to extrapolate how your low concentration sample will behave once it’s scaled up and at higher concentrations used for clinical administration. This is critical for de-risking the selection process and ensuring that you’re progressing the most optimally stable candidate through the pipeline.
Check out these real examples of data from Prometheus Panta, which compare a naked antibody, Trastuzumab (or Herceptin) versus an ADC derived directly from it, Kadcyla, and another ADC derived from a similar naked mAb, called RC48.
Background on thermal stability experiments
First, it’s important to understand what a standard thermal stability experiment looks like. This topic is covered much more in depth here. It’s straightforward to do these experiments on Prometheus Panta, using the same sample to collect information for ranking candidates by their thermal stability, such as Tm and Ton – as well as by their colloidal stability via PDI, Tsize, and Tagg.
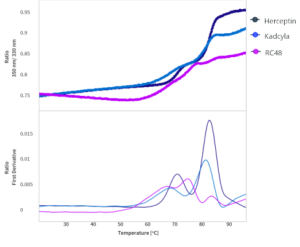
Briefly, begin by comparing the triplicate thermal unfolding curves of each therapeutic.
- Herceptin, the naked mAb, has the highest thermal stability, with higher Tm1 compared to either ADC and sharper unfolding transitions
- Kadcyla and RC48 both exhibit peak broadening for Tm1, indicating that most of the drug is conjugated to the domain associated with that transition – this is good, as Tm1 corresponds with the CH2 domain, while Tm2 and Tm3 are the Fab domain and CH3, respectively – though these are often close together, displaying only a single Tm2
- RC48, which is an ADC built from a different parent mAb, shows a slightly further decreased Tm1 compared to Kadcyla. Further, it’s possible to tell it is a different naked mAb from Herceptin because there is quite a substantial change in the unfolding profile, including the ability to resolve Tm2 and Tm3 separately
Together, the high-resolution thermal unfolding data from Prometheus Panta gives highly detailed resolution on the unfolding of each ADC or mAb, making it possible to resolve differences down to 0.2°C at the domain level.
All three of these therapeutics have been optimized for use in the clinic, so the changes in stability are optimal, unlike when you’re comparing candidates early in the development process, such as screening different conjugation strategies. However, these data examples are a good way to see how the conjugation process affects the stability characteristics of your ADCs.
Predictive data: 3 experiments to learn more about your ADCs
With the thermal unfolding profiles covered, it’s time to take a look at the predictive parameters that are measurable with Prometheus Panta.
1. Self-association
Self-association parameter kD and second virial coefficient B22 are both parameters that inform on how a biologic is likely to behave at high concentrations. Positive values for either of these indicate that they are unlikely to self-associate – this is a desired outcome. Self-association drives aggregation and high viscosity, and since many therapeutics are administered at high concentrations in the clinic, it’s ideal to have a picture early on in the development process about whether your ADC will be prone to self-association.
For more information on how these experiments work, check out this video.
Self-association parameter kD
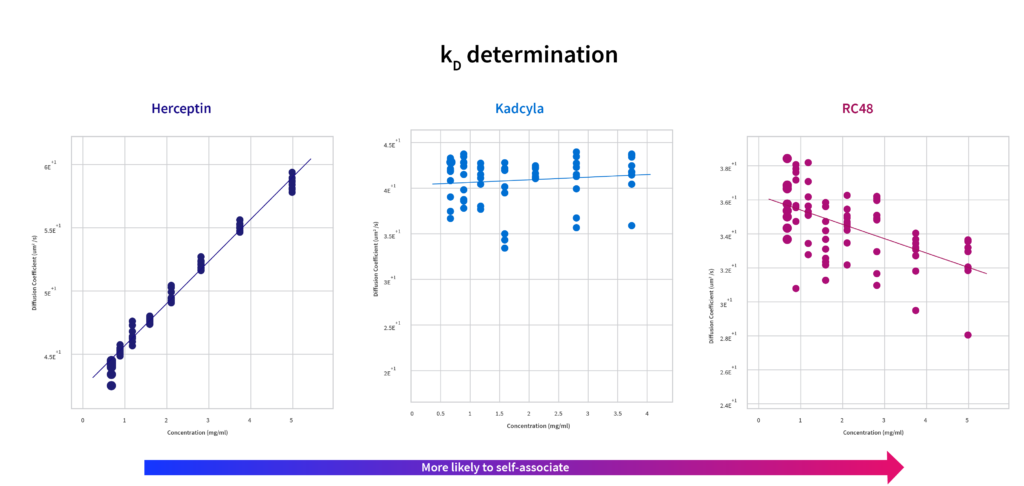
Self-association parameter kD uses the information about the diffusion constant derived from DLS to assess the likelihood a molecule interacts with itself. Positive kD indicates repulsive forces (which are good); negative kD is attractive (which is to be avoided). The data for these biologics show:
- The naked mAb is highly self-repulsive, exhibiting a positive kD with a strong trendline. This means it is unlikely to be driven by self-interaction forces at high concentrations. The value found in Prometheus Panta lines up well with other published values
- Kadcyla also has a positive kD, though it is not as strongly self-repellant. However, it’s still considered a “good” result, with a positive kD
- RC48 shows a tendency to self-associate
Second virial coefficient B22
The second virial coefficient B22 is derived from SLS and looks at global strength of interactions. Though there is a relationship between B22 and kD, they are determined independently of each other, and therefore do not always line up perfectly. Scattering data from SLS is more prone to error at the low concentrations used for these experiments. However, some researchers prefer B22 to kD because the data is considered a more “global” measurement of interactions within the sample.
In the case of the specific examples shown here, trends for these constructs look very similar to those found with the kD.
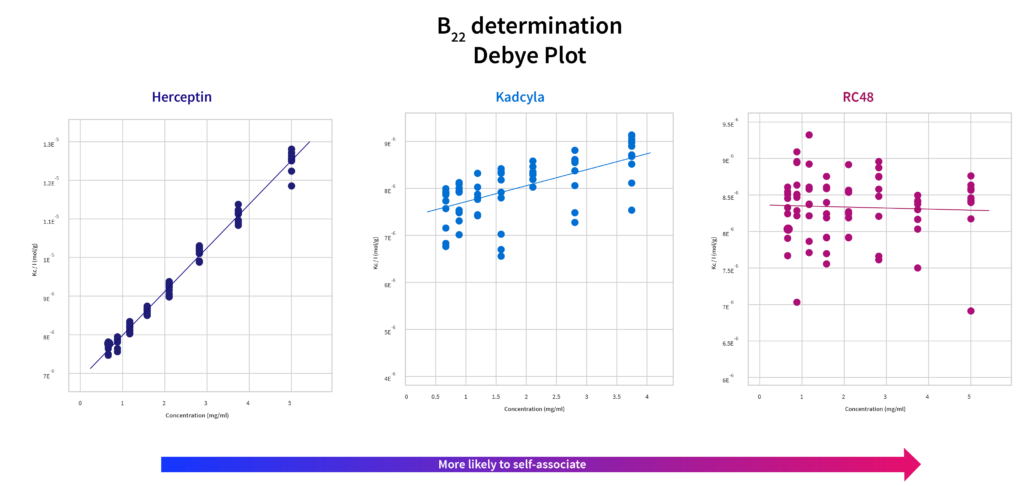
The self-association values calculated for Herceptin by the Prometheus Panta data reflect literature values well.
These self-association experiments require a little bit more setup than a thermal gradient or size analysis experiment, but they give you important predictive information about your ADCs before you scale up.
2. Kinetic stability
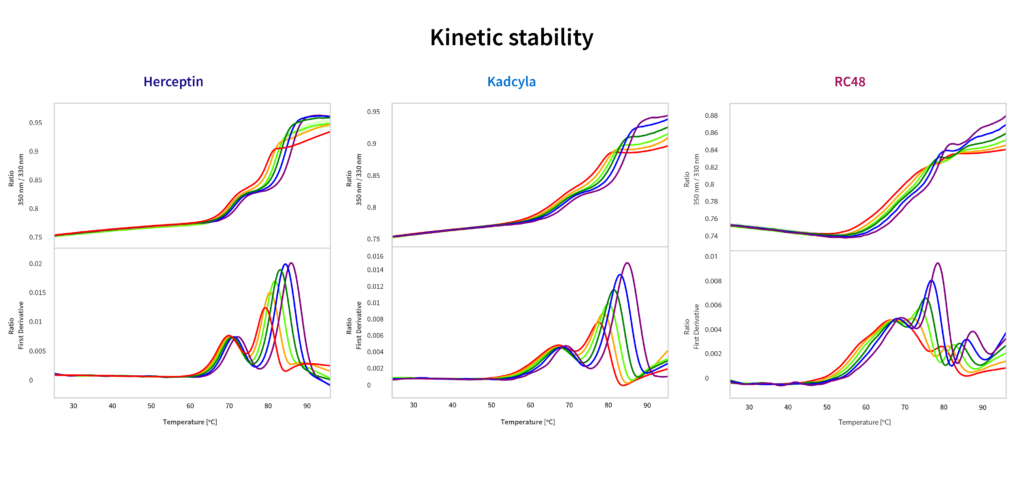
Kinetic stability experiments look at the thermal stability behavior of a candidate when the thermal unfolding experiments are set up at different ramp rates. By measuring how quickly the protein unfolds as the heat input rate changes, it’s possible to calculate the activation energy of unfolding. To do this, simply set up a series of thermal unfolding ramps at different rates, then compare how the melting temperatures change with the rate.
This information is then used to predict the half-life of the construct at different storage temperatures, using the Arrhenius equation.
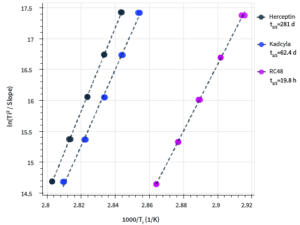
How these three candidates compare:
- Shows kinetic stability Herceptin > Kadcyla > RC48, which echoes the self-association behavior trends
- Kadcyla has a significantly decreased halflife compared to Herceptin, but is still around two months
- Half-life for RC48 is very low; suggest that the conjugation method is particularly destabilizing
3. Isothermal stability at 62°C
Isothermal stability is an alternative way of doing accelerated stability studies. Similar to the kinetic stability experiment, it’s possible to use the stability at an elevated temp over a shorter period of time to extrapolate long term stability at -20°C, 4°C, or RT.
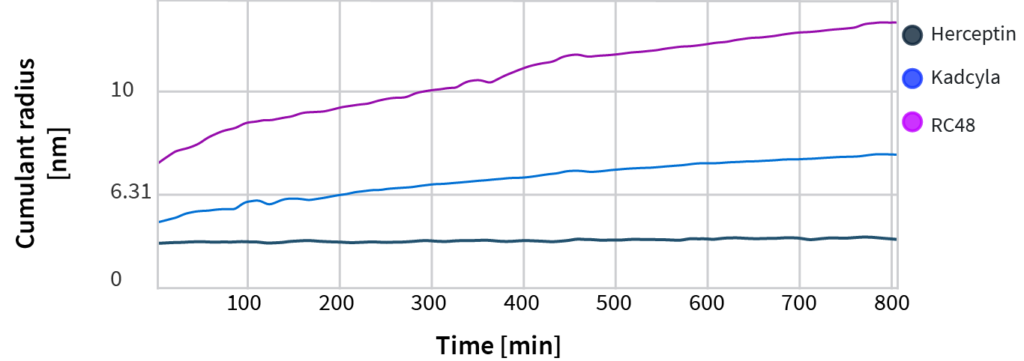
What trends we see for the candidates:
- Follow the cumulant radius, which is sensitive to even slight unfolding events
- No discernible size change for Herceptin after 800 minutes (13+ hours) at 62°C
- Noticeable size changes for both ADCs; more pronounced size change for RC48 once again indicates it is the least stable of all candidates
Conclusion
The experiments shown above take a little more time and material to set up than thermal unfolding curves, but are valuable for predicting long-term stability. During early development and risk assessment, they provide added predictive information on the top candidates you select to progress further through drug development.
These experiments require less sample than many other downstream assays, so it’s worth taking the extra time and effort to pre-screen your selections prior to further assays. Predictive assays like these are great for getting a deep insight into what impact the conjugation process had on your ADC.
Working with biologics?
Sign up to receive the latest eBooks, product updates, event announcements, and more
