
SLS measurements are typically performed at multiple concentrations. The relationship between scattering and concentration is described by the Debye equation:
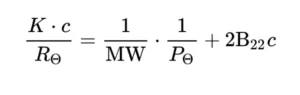
Where:
– K is an optical constant (depends on wavelength and refractive index)
– c is the concentration
– Rθ is the Rayleigh ratio (proportional to scattered intensity)
– MW is the weight-average molecular weight
– A2 (or B22) is the second virial coefficient
Plotting Kc/Rθ versus concentration produces a linear relationship. The y-intercept gives 1/ MW, and the slope gives 2*B22.
Parameters you measure with SLS.
Parameters you measure with SLS.
Molecular weight (MW)
The weight-average molecular weight of particles in solution. This confirms the oligomeric state (monomer, dimer, tetramer, etc.) or detects aggregation. For example, if you expect a 150 kDa monomer but measure 300 kDa, your protein is forming dimers.
Second virial coefficient (B22)
A measure of protein-protein interactions. Positive values indicate repulsive interactions (good for formulation). Negative values indicate attractive interactions (risk of aggregation).
Initial scattering intensity
A quick quality check. Very high scattering suggests large aggregates or particulates. Very low scattering may indicate the sample is too dilute for reliable DLS measurements.