Assistance with your assay setup
Panta.Control automatically detects the capillaries that contain protein sample. Select the experiment type you want to run, and it will guide you through the set up process. The software monitors your experiment and if something’s a bit off, it will alert you with a warning message.
Collect lots of stability information in a single experiment
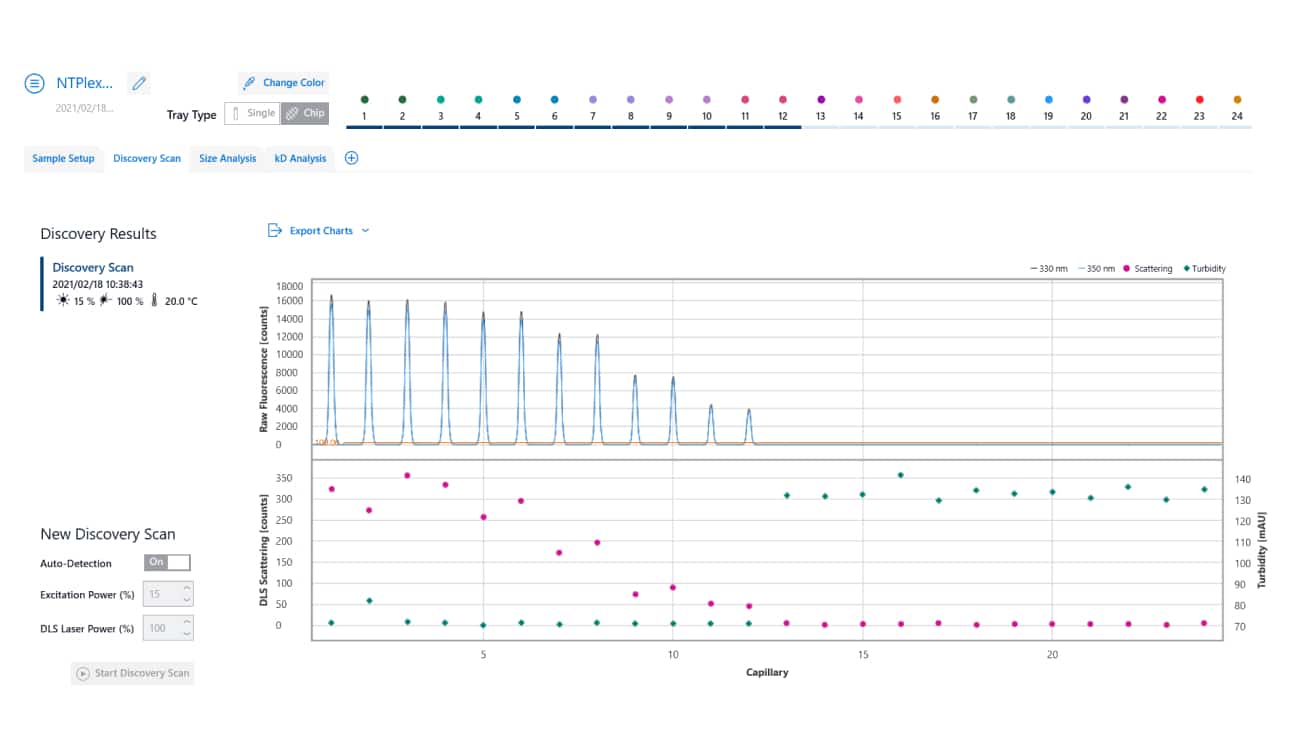
Collect stability data from nanoDSF, backreflection, and DLS technologies from the same samples, in the same run, along an entire thermal ramp. Calculate Tm, Tonset, Tturbidity, Tsize, and Tscattering automatically with built-in algorithms.

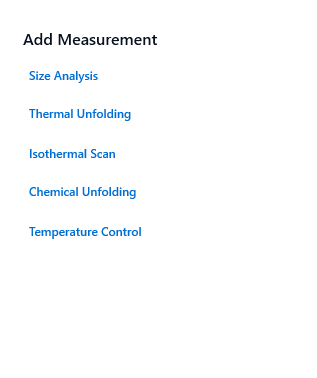
Set up additional experiments within the same file
Running multiple batches of samples? Want to run self-association experiments prior to your thermal ramp? Doing accelerated stability studies? Add all those experiments into a single tabbed control file for easy organization and documentation of experiment progress.
Unprecedented throughput for your protein stability screening
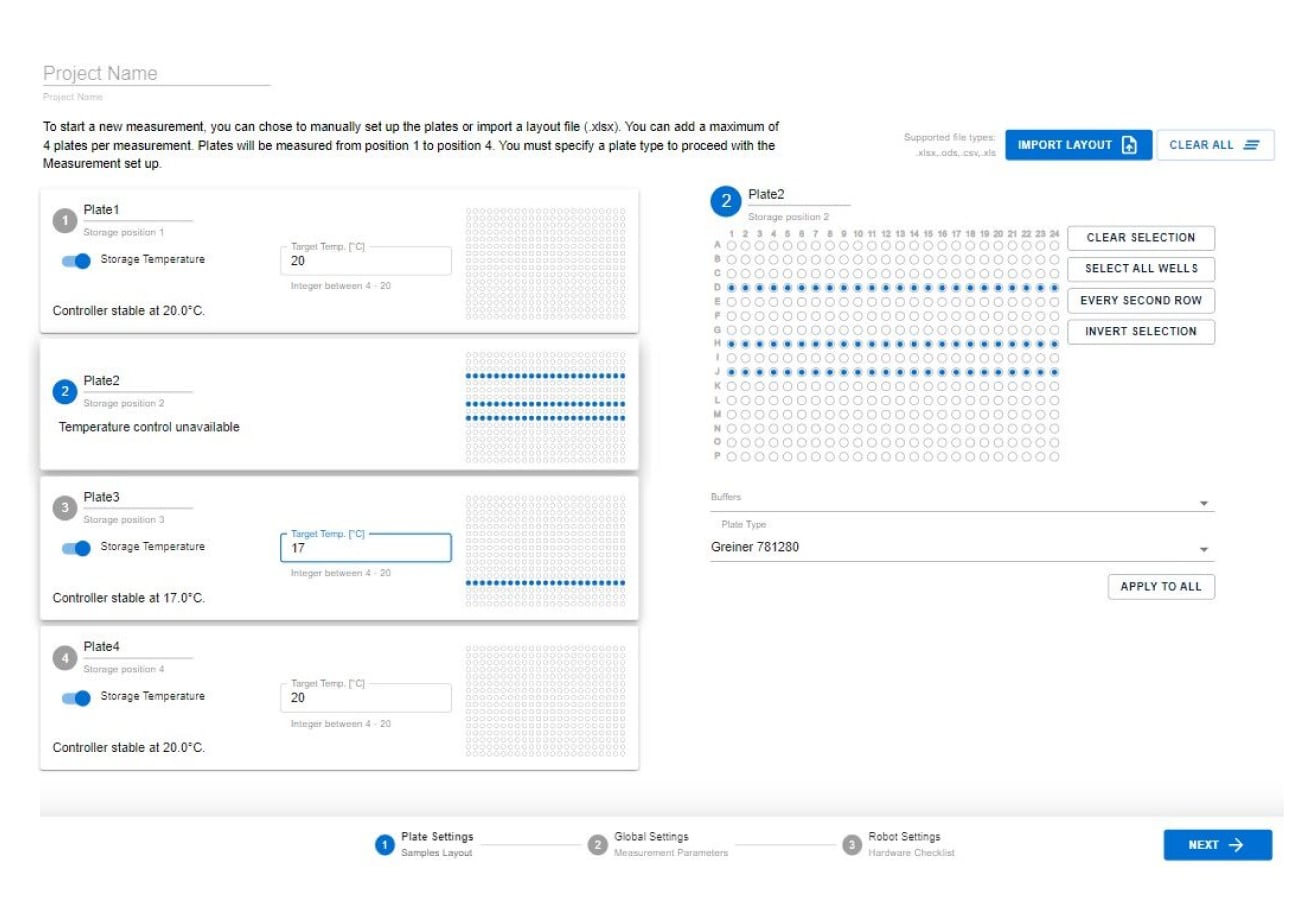
Panta + Robotic Autosampler enables stability measurements on up to 1536 replicates without having to reload your samples. Set up four 384-well plates with your candidates of interest, import your well layout, and you’re ready to go.
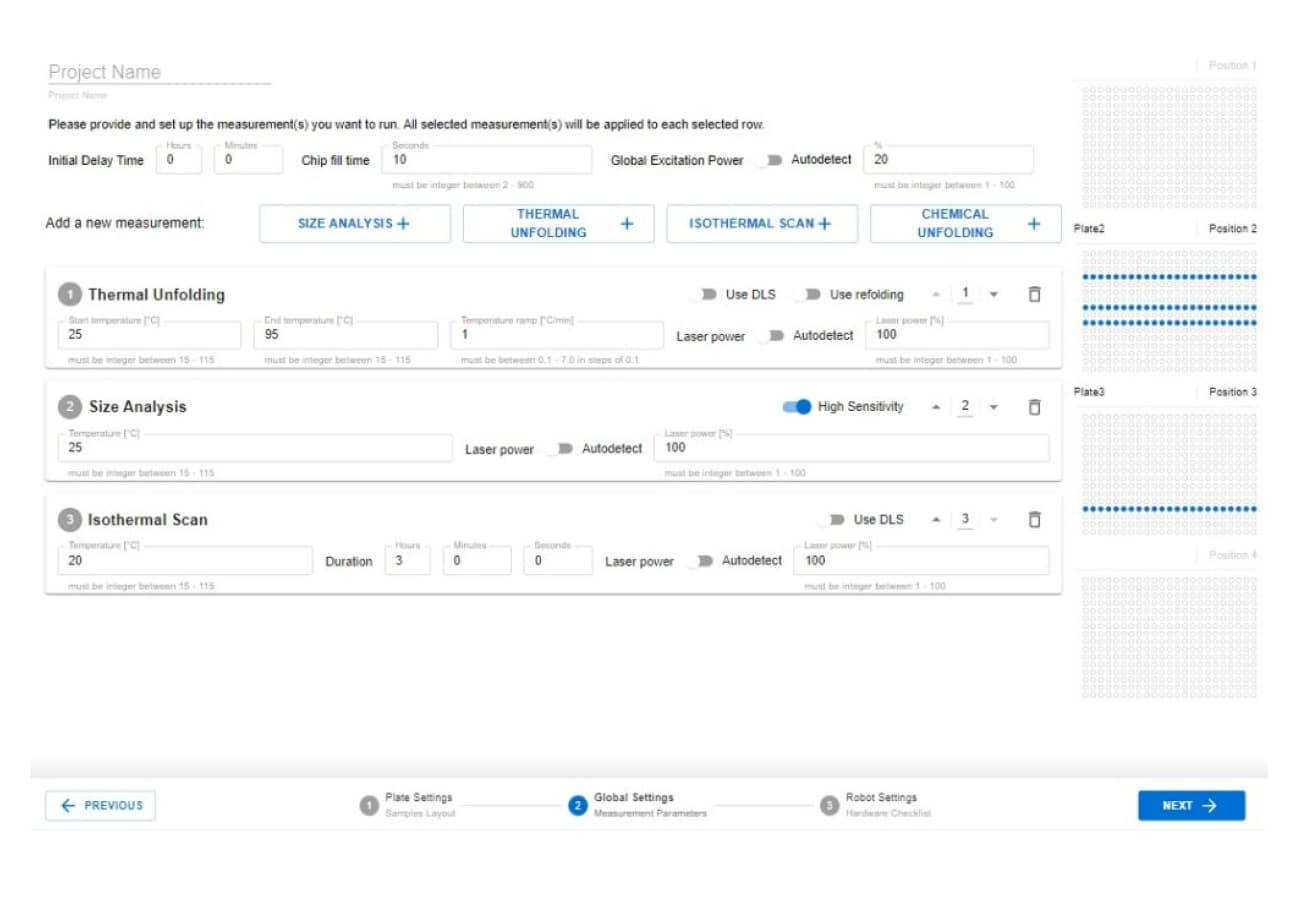
Get more data out of more samples
Panta AutoControl helps you set up multiple experiments on the same samples, so you get more information for your projects. Choose which experiments to run – mix and match, or run the same measurements on all your samples.
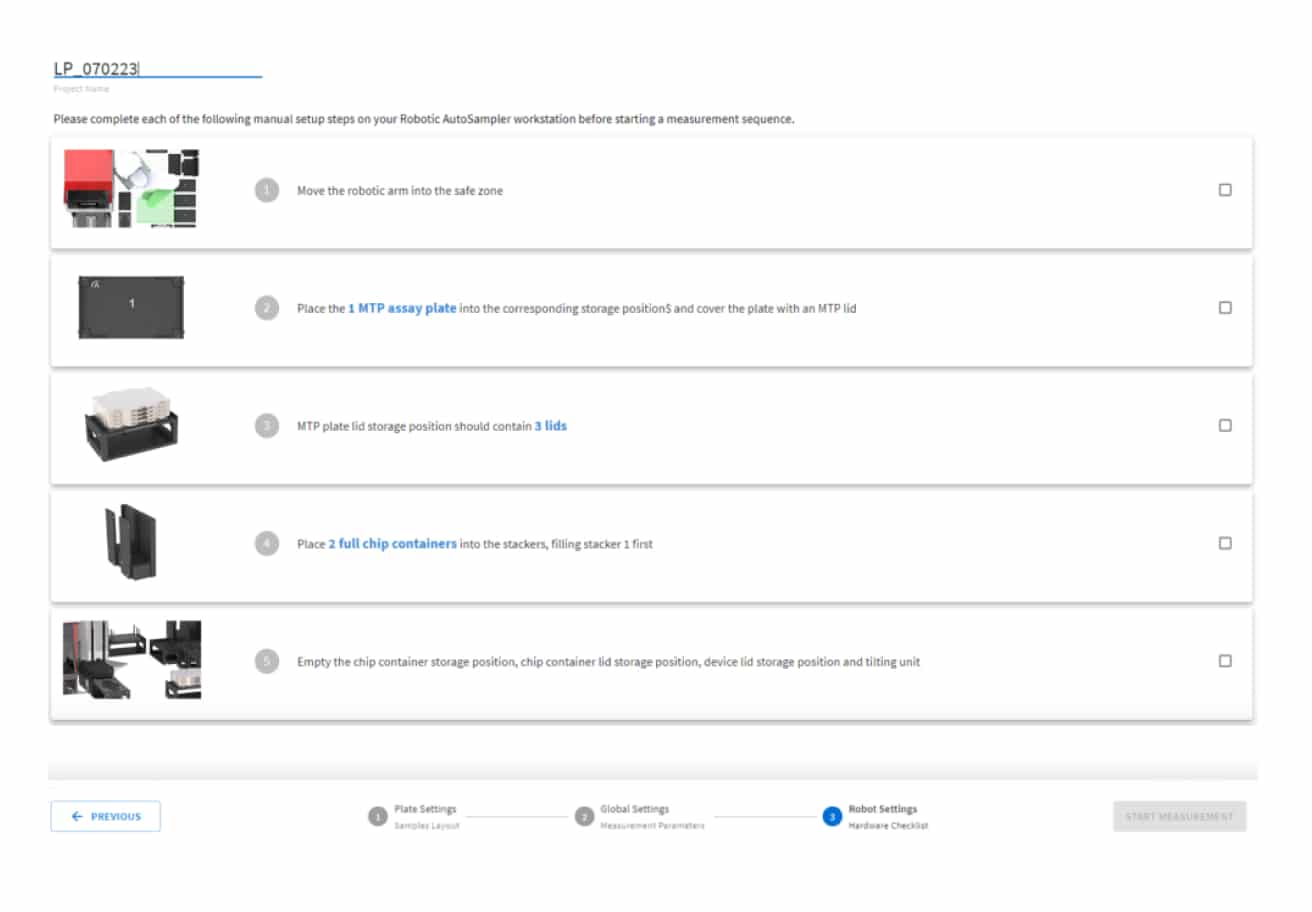
Built-in safety control
To protect the safety of your labmates, as well as the integrity of your robotics, the Robotic Autosampler won’t run if the enclosure is open. Plus, before you run your experiment, clear software prompts help you check that your samples and materials are loaded correctly. The result is a high-throughput instrument that requires minimal training for safe use.

Combine data from multiple runs
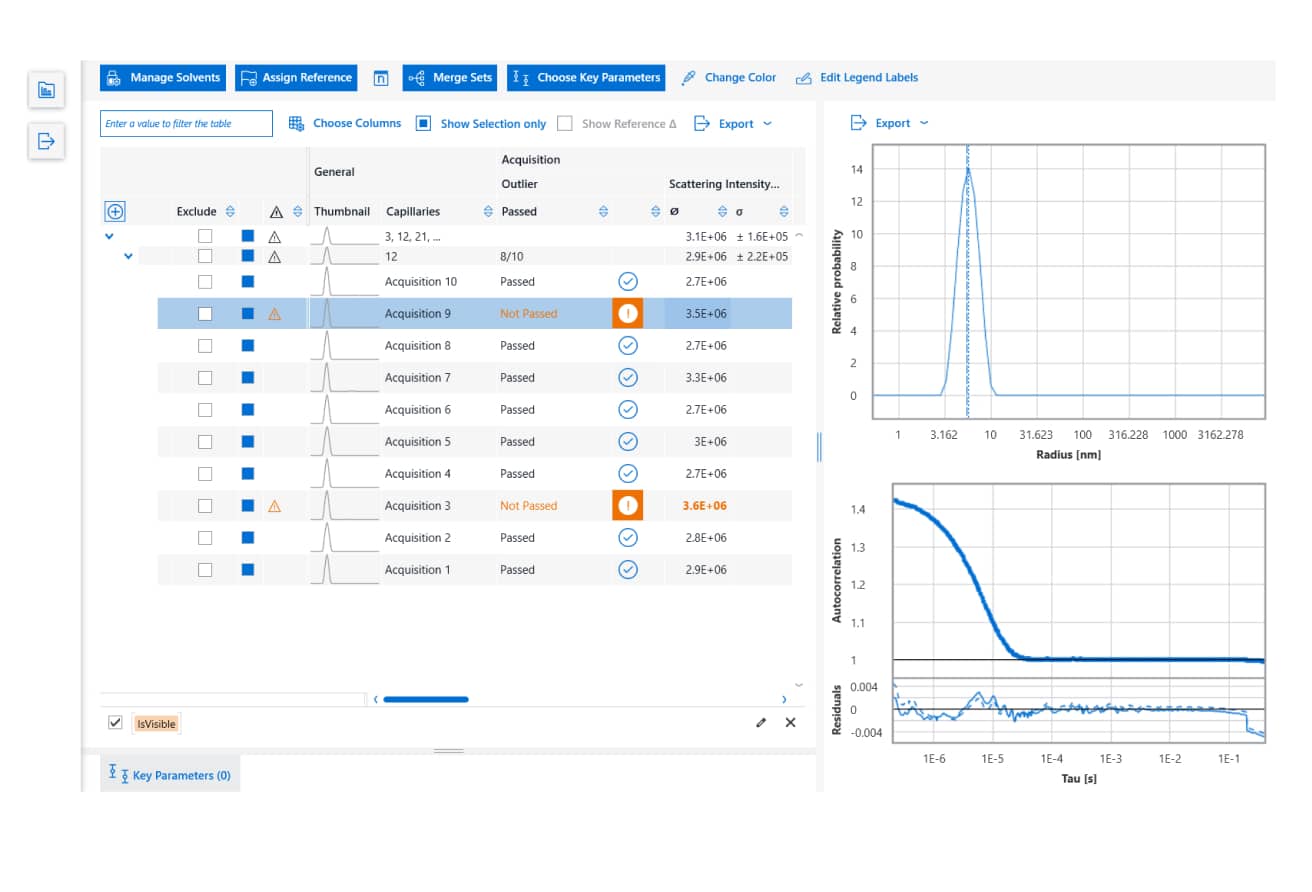
Whether you’re analyzing data from a single run or comparing multiple data sets, Panta.Analysis has your answers. Merge all your data, view the results, and get statistical analysis on your replicates.

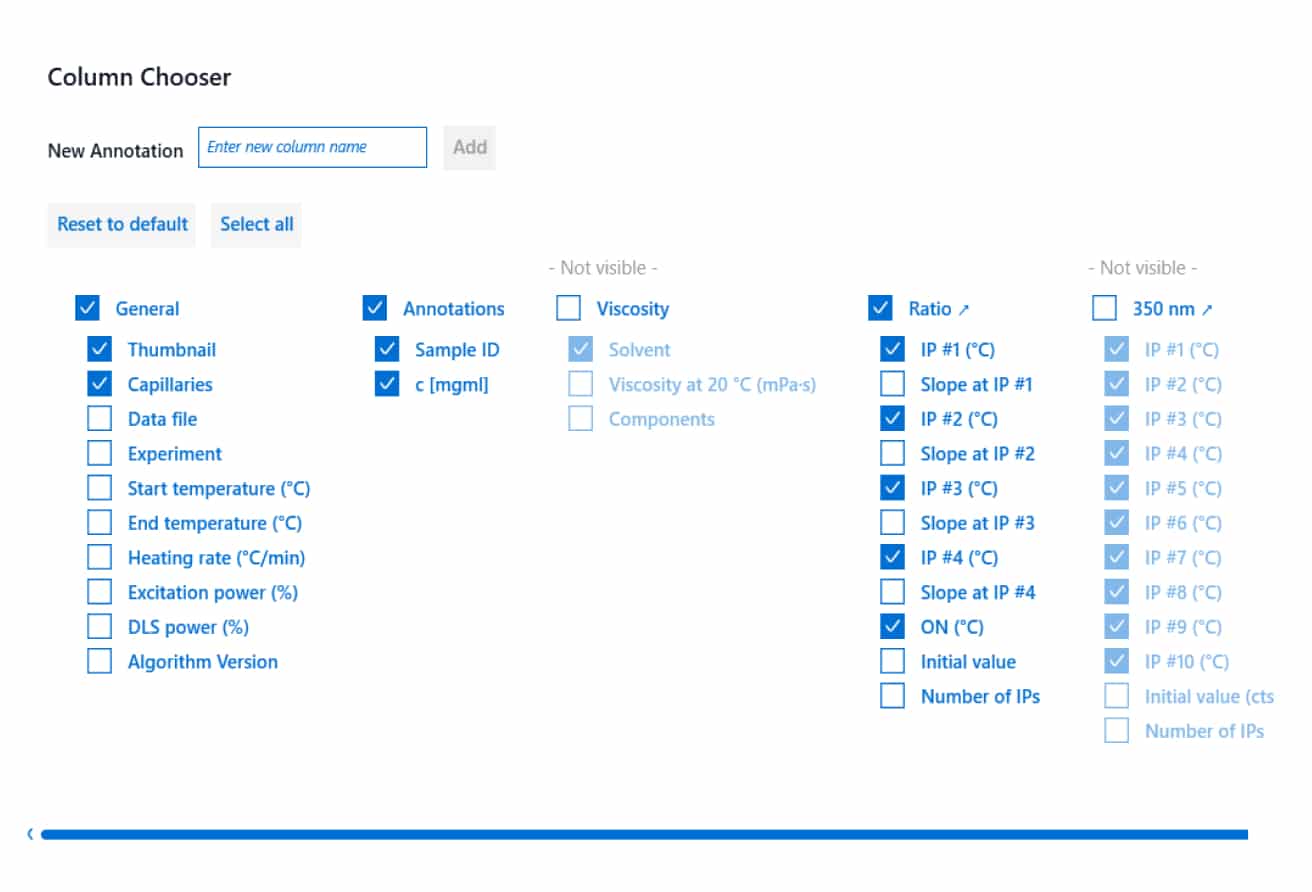
Customize the way you collate data
Get you a jump on data interpretation with a ton of parameters to display and rank. Choose to display only those that help you determine which constructs or conditions are having an impact on your protein’s stability.
Make templates to standardize your analysis
Generate custom templates to tailor how you view your experimental data. Save export settings, references, and analysis templates as a library of settings for you or your labmates to use for future experiments.
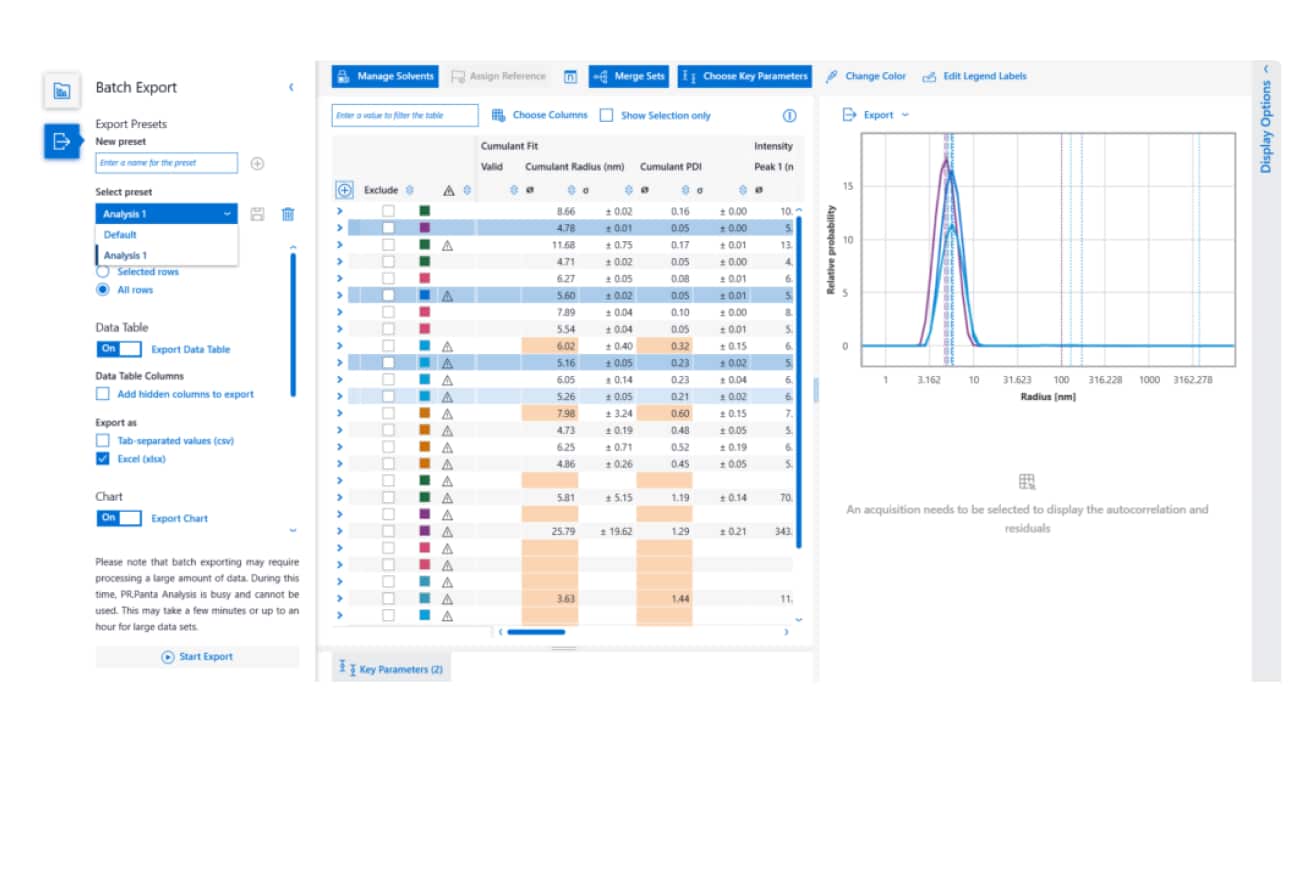
Spend less time double-checking your results
All your data is analyzed with built-in quality checks and data-fitting. Outliers are automatically flagged and removed from results, and data is automatically fit with both regularization and cumulants fits to provide insight on your samples.