Data Export
Dianthus software solutions allow users to export all measured raw data, fitted curves, graphs and plots as well as metadata such as the result of Quality Checks. There are several options to export data in DI.Control and DI.Screening Analysis.
Export from DI.Control:
From DI.Control the table that includes the information on plate mapping as well as measured raw data can be exported as csv or xlsx by choosing the button Export Table:
![]()
Figures and graphs can also be exported as png or pdf (vector graphics) by choosing the Export button above a given figure:
![]()
Export from DI.Screening Analysis:
From DI.Screening Analysis there are also multiple ways of exporting information. The ligand table on the ligands page can be exported by choosing the Export Table button on the top right:
![]()
Figures and graphs (and the raw data) can be exported as png or pdf (vector graphics) by choosing the Export Graphs button in the review panel, where the figures are located on the ligands page. Then, select the figure for export and in the opening window select export as either png, pdf or csv (raw data). The Export Chart function can also be found for the charts on the Reference and Summary page:
![]()
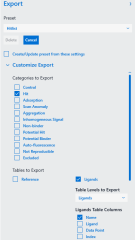
Note that DI.Screening Analysis software also has a batch export function, which can be found on the Summary page. Choose the Customize Export button to see all available options. From this panel all data and charts can be selected and exported into one folder at once. The selection of charts and data to export can also be saved as a preset that can be used for future exports: