Fnorm
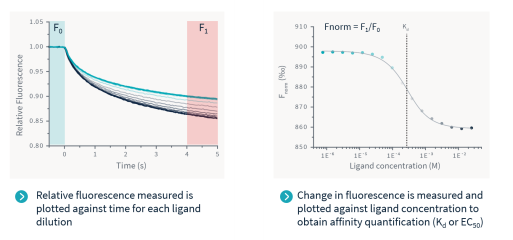
For binding affinity analysis, ligand-dependent changes in TRIC are plotted as Fnorm values vs. ligand concentration in a dose-response curve. Fnorm values are plotted as parts per thousand (‰). For each well (each data point), a TRIC trace is recorded. All traces are then normalized to start at 1 (relative fluorescence). For each trace, the Fnorm value for the Dose Response Curve is calculated by dividing F1 by F0. F1 corresponds to the fluorescence value measured in the heated state, while F0 is the fluorescence value measured in the cold state before the IR laser is turned on. Both values are averages taken between two time points signified by two cursors (red and blue).
Note that an Fnorm Outlier can be automatically identified and excluded from analysis by Dianthus software during the fitting of affinity data.