Request Quote

Choose the software package you need to get the most out of your Prometheus NT.48

This software is for the NT.48 and NT.Plex Prometheus instruments, which as of November 6, 2023 have been discontinued. Software packages are still available for purchase for those who already own either instrument, but software will no longer receive updates. To learn more, please contact a specialist.

Software that gets you up and running in no time

Prometheus software is designed to help you hit the ground running with your stability experiments. Design and execute thermal or chemical stability experiments with a few clicks, and customize your annotations and results display using Control software. And when it’s time to make decisions with your data, Analysis software makes it easy to toggle which parameters you use and rank for selection – all with a clean and intuitive user interface that makes identifying stable proteins a breeze.

Design and run multiple experiment types with ease

Become an expert right out of the box with intuitive software for your protein stability characterizations. Assay setup requires 3 quick steps and the selection of a few experimental settings. While your experiment is running, label your samples — even color code them if you want — and sit back while the results are generated for you. Select the data you want to display or review, and finish by exporting your findings with a few clicks.
Prometheus Therm Control Logo

PR.ThermControl

Assistance with your assay setup

PR.ThermControl automatically detects the capillaries that contain protein sample. Select the temperature slope and range from a few dropdowns and your run ready to take off. The software monitors your experiment and if something’s a bit off, it will alert you with a warning message.
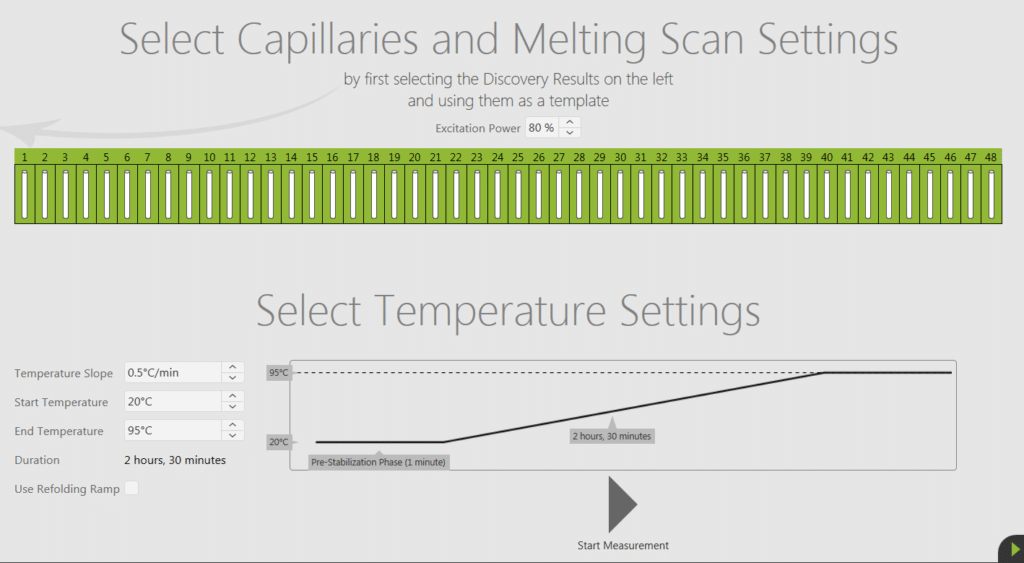
http://Prometheus%20ThermControl%20Settings
Annotate while you wait

While your experiment is running, label your samples and even color code them to keep your records in order. If you already have your sample labels saved, it’s easy to copy and paste that info into your protocol template.
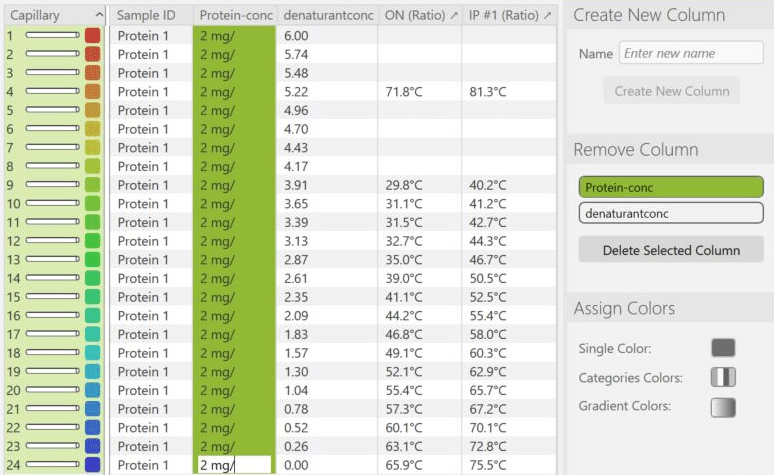
http://Prometheus%20ThermControl%20Annotation
Summary data generated automatically

At the end of your run, PR.ThermControl automatically summarizes the Tm, Tonset and Tturbidity data for your protein. Highlight what you want to see from the entire data set and draw your initial conclusions.

If you need more detailed analysis, check out PR.Stability Analysis software.

http://12
Protect your data with optional CFR21 part 11 control software

Prometheus PR.ThermControl software supports 21 CFR Part 11 compliance for regulated environments. It provides electronic signatures, an audit trail with record of all activities, user permission settings, and access management.
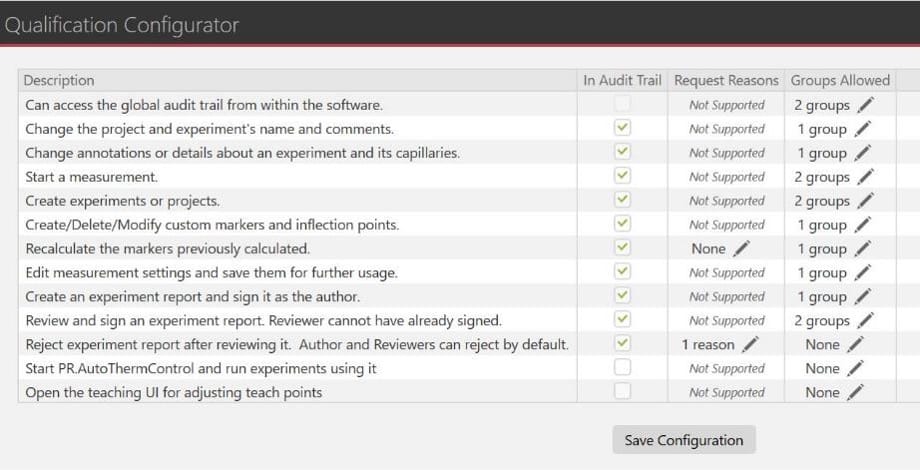
http://Prometheus%20NT.48%20TimeControl%20CFR21%20part%2011%20control%20software
Prometheus ThermControl Settings ThermControlAnnotate page with capillary, sample ID, protein concentrations, columns, colors ThermControlResults_edited-3 zoomed in two stacked graphs with green and blue and royal blue colored lines Prometheus NT.48 TimeControl CFR21 part 11 control software Qualification Configurator
Prometheus Chem Control Logo

PR.ChemControl

Rapid assay setup
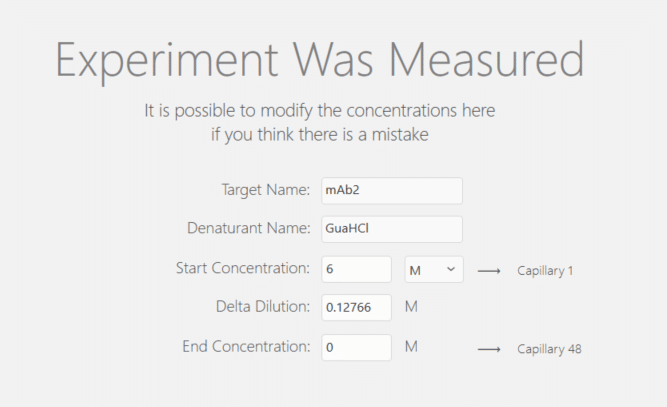
Simply enter a few details about your chemical denaturant and the program automatically fills in the rest.
http://ChemControl-Setup
One-click experiment
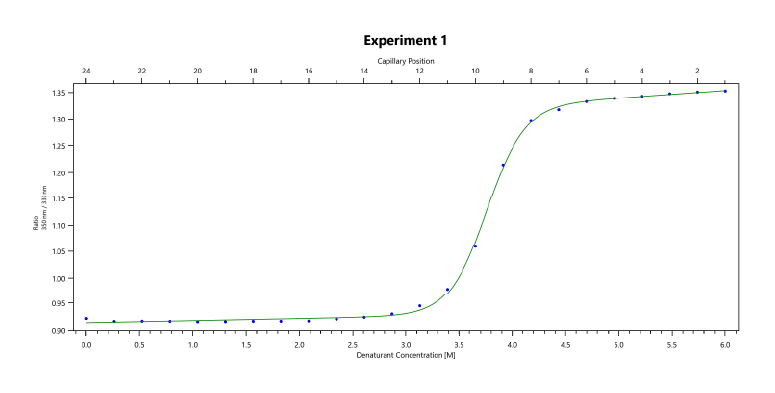
Once your samples reach unfolding equilibrium, it takes 40 seconds to collect chemical unfolding data. The high sensitivity of the 350 and 330 nm fluorescence detector ensures precision of your measurement.
http://Prometheus%20NT.48%20ChemControl%20Chemical%20Unfolding%20Lysozme
Immediate data output
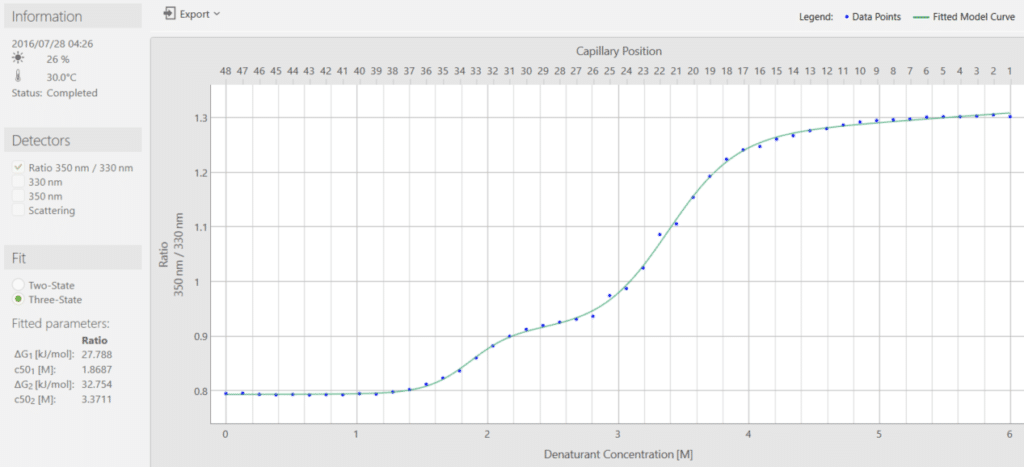
The C50(denaturant concentration at which 50% is folded and 50% is unfolded) of your sample and the ΔG of unfolding is determined automatically from the data. Choose a 2-state or 3-state unfolding model.
http://ChemControl%203%20state%20unfolding%20model
ChemControl-Setup experiment was measured page with info Experiment 2 capillary position graph with green line and blue dots, denaturant concentration and ratio axes Capillary position graph with denaturant concentration x-axis and ratio y-axis
Prometheus Time Control Logo red

PR.TimeControl

Find unique unfolding trends with customizable thermal ramps
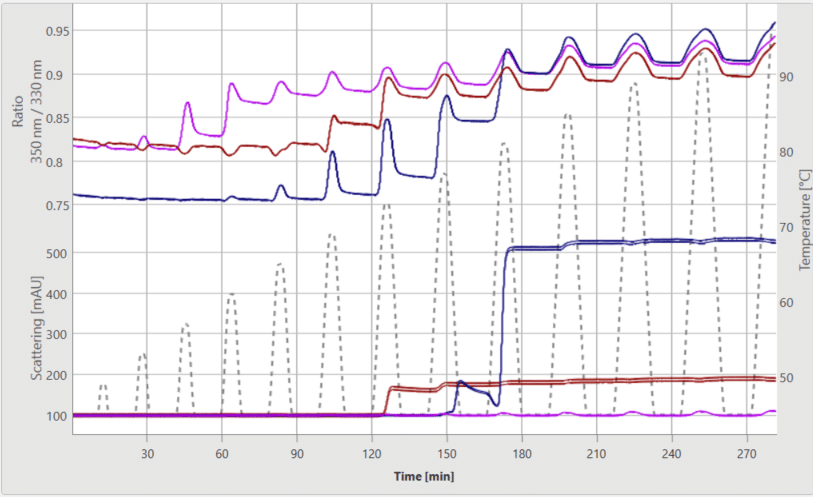
When a simple folding/unfolding ramp isn’t enough, TimeControl gives you more control over the thermal ramp. Choose multiple different cycling options, including temperature stepping, two-step cycling, or incremental cycling, or run your samples in an isothermal measurement.
http://Prometheus%20NT.48%20TimeControl%20Temperature%20Cycling%20and%20Stepping%20Scattering%20and%20Ratio
Reveal long-term stability of your samples
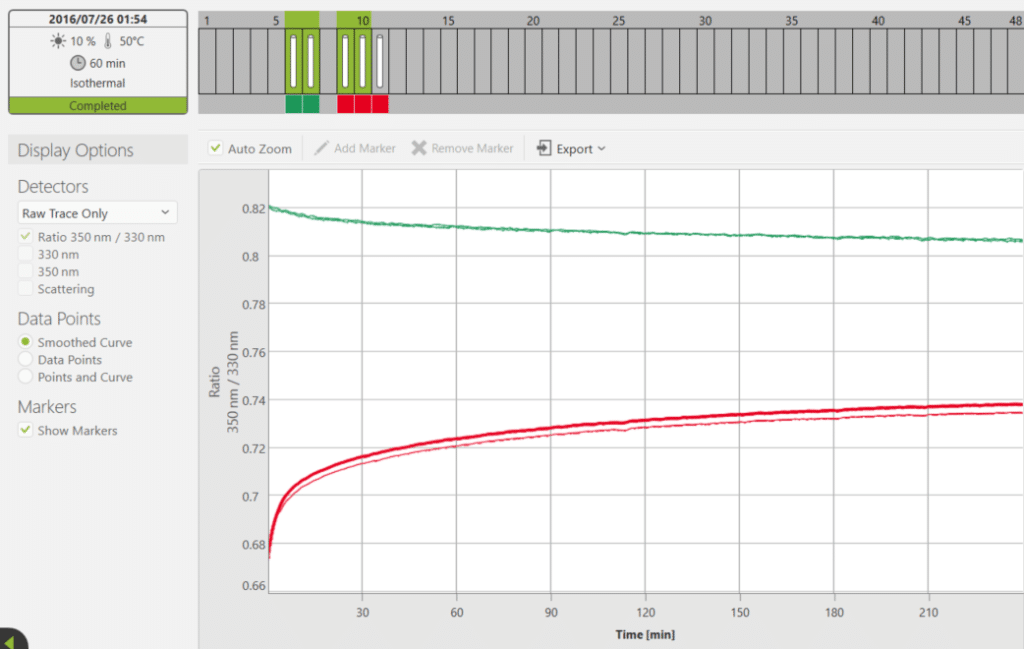
Protein folding and unfolding is a complex process, and with customizable thermal ramps, you get new insights into protein recovery. Determine if aggregation or unfolding is reversible, or at what temperature it becomes reversible. Conduct accelerated stability studies in isothermal mode. Or determine how long it takes for a chemical denaturant to reach unfolding equilibrium.
http://Prometheus%20NT.48%20TimeControl%20Isothermal%20Treatment
Graph with magenta, purple, and red lines, time x-axis and scattering and ratio y-axes Graph with red and green lines, time and ratio axes

Have confidence in your results and conclusions

Prometheus Stability Analysis software is designed for when you have large sets of data to parse, or need to compare samples run-to-run. It provides powerful analysis features, including auto-merging, the ability to focus on regions of interest, and fully customizable templates of stability parameters.
Stability analysis software allows you to:
  • Combine data generated from your Prometheus NT.48 system using PR.ThermControl or PR.ChemControl to pinpoint trends and provide statistical analysis of your merged replicate data sets
  • Select how you want to group and organize the information so you get conclusions faster
  • View all your data or highlight a subset of the information to monitor unfolding trends
  • Save your preferred settings and evaluation parameters as a template or reference and easily access it for your next run
  • Customize exports to summarize everything or just the data you need
Red icon with white book image

PR.StabilityAnalysis

Bring together data from multiple runs
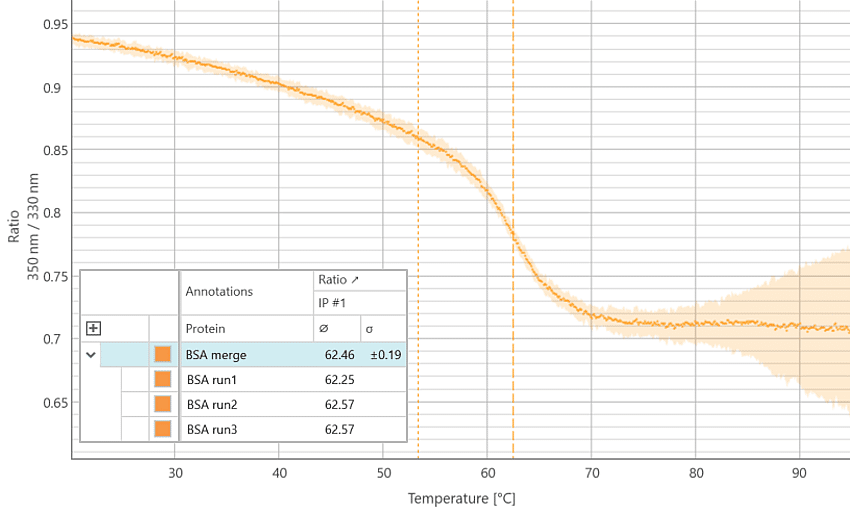
Whether you’re analyzing data from a single run or comparing multiple data sets, PR.Stability Analysis has your answers. Conveniently view all the data in one view and get statistical analysis on your replicates.
http://Prometheus%20NT.48%20Stability%20Analysis%20Merged%20Set
Customize the way you collate data
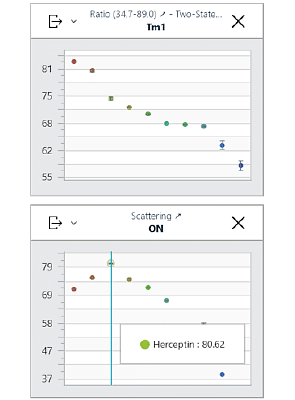
Get you a jump on data interpretation with a ton of parameters to display and rank. Choose to display only those that help you determine which constructs or conditions are having an impact on your protein’s stability.
http://Prometheus%20NT.48%20Stability%20Analysis%20Key%20Parameters
Make templates to standardize your analysis
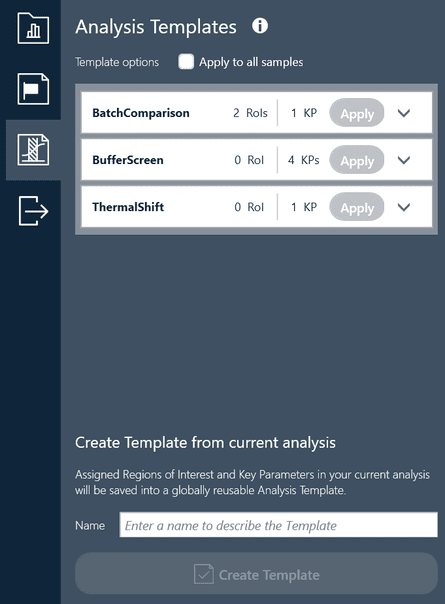
Generate custom templates to tailor how you view your experimental data. Save export settings, references, and analysis templates as a library of settings for you or your labmates to use for future experiments.
http://3_PRSA_analysistemplate
Batch export exactly what you need
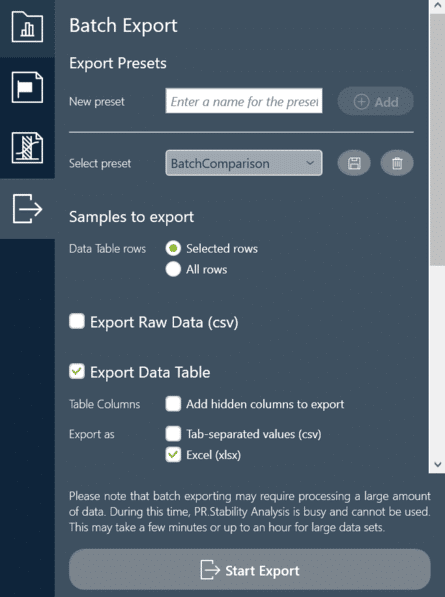
Export exactly what you need from all the data you compiled in just a few clicks. Your export will compile in a format that’s ready for publications, presentations, or transferring to your lab notebook.
http://4_PRSA_batchexport
Graph with orange line, Annotations for Proteins, temperature and ratio axes Ratio and Scattering graphs with Hereceptin zoomed in 3_PRSA_analysistemplate Analysis templates create template page 4_PRSA_batchexport batch export start export page
Gradient spot

Want to learn more about Prometheus NT.48 software?