Kd Fit Model
The Kd fit model describes a molecular interaction with a 1:1 stoichiometry according to the law of mass action. Interactions in which several molecules A bind to one molecule B, but all binding sites have the same affinity for A, can still be described by this model because the binding events are independent (for the opposite situation, see Cooperativity . DI.Screening Analysis software offers two fitting models, the Kd model and the Hill Model. The Kd model is suitable for the vast majority of investigated interactions. Use the Hill model only for data evaluation if the investigated interaction is known to be cooperative.
The initial fluorescence influences the measured Fnorm data and needs to be accounted for
The Fnorm is calculated by dividing fluorescence values from the TRIC trace after the laser is turned on (hot region, F1) by values that are obtained before the laser is turned on (the Initial Fluorescence or cold region, F0).
A Ligand-Induced Fluorescence Change can influence the measured Fnorm-values of the Dose Response Curve that are used to fit the Kd. A strong change in initial fluorescence not only causes a difference in amplitude, but also a shift of the Dose-response curve along the X-axis, even though the Kd is the same. Therefore the influence of the ligand induced fluorescence change, has to be corrected when fitting the dose-response curve of the Fnorm.
Example
This example demonstrates the shift of the F norm curve along the X-axis. We use an assumed Kd of 30 nM and a target concentration of 5 nM to simulate the Fnorm values. The fluorescence of the F1 region is determined by the unbound state (4250) and the bound state (4500), both values kept constant.
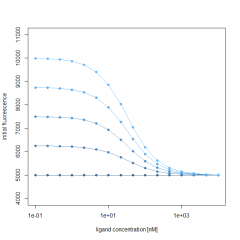
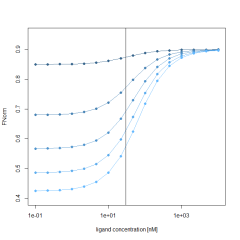
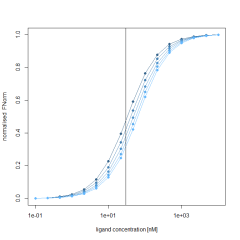
Additionally, the initial fluorescence (F0 region), is also described by the same Kd and target concentration and a fixed bound state of 5000 fluorescence counts. To simulate the influence of a changing initial fluorescence, the unbound state is varied between 5000 and 10000. Calculating the Fnorm by using the above formula results in a varying Fnorm with not only different amplitudes, but also a shift along the X-axis. This shift is best observed in the normalized Fnorm values. This clearly shows that the initial fluorescence change, if present, must be accounted for when fitting Fnorm data to obtain Kd values.
Kd – model with ligand induced initial fluorescence change
With the help of mass-action kinetics we are able to derive a formula for the fraction bound in case of a binding event. The fraction bound is defined by the binding affinity Kd and the concentration of the target molecule and depends on the ligand concentration.
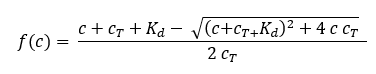
where f(c) is the fraction bound at a given ligand concentration c Kd is the dissociation constant or binding affinity and cT is the final concentration of target in the assay.
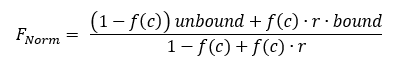
The measured fluorescence F of the F1 and the F0 region is defined by the fraction bound and the fluorescence of the unbound and bound state of the binding event.
![]()
Assuming that the target concentration is much lower than the Kd, the Kd is typically identical to the inflection point (half maximal effective concentration) of the Fnorm. This changes when the ligand induces a change in initial fluorescence. In these cases, the Fnorm used for the calculation of the Kd is influenced by the change in initial fluorescence. Hence, this influence on the Fnorm needs to be accounted for. The Kd no longer aligns with the inflection point of the dose-response curve of the Fnorm.
Therefore, it is necessary to account for this change of initial fluorescence while calculating the Kd. Using the above formulas we derive a model that takes all of this into consideration and still can be easily fitted to the measured Fnorm.
With
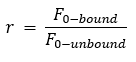
For the Kd fit, we calculate r from the measured initial fluorescence and use it as a constant in the formula fitted to the Fnorm data. The factor r is also called initial fluorescence ratio and can be displayed optionally in DI.Screening Analysis software as a column in the ligands table. There are three fit parameters that have to be calculated; unbound and bound of the F1 region and the Kd . The target concentration is a constant in the formula.
If there is no variation in the initial fluorescence, then r = 1. Inserting this in the formula of the Fnorm reduces the formula to:
![]()
Outliers from fitting
A fitting method that makes the analysis robust against Outlier data points is used. Because of this outliers of the dose response curve can be identified. To determine the outliers, the fit residuals (model – data points) are calculated and the interquartile range (IQR) of the residuals is determined. Every residual that is smaller than 2*IQR of the lower quantile or bigger than 2*IQR of the upper quantile is considered an outlier.
Robust fitting
Fitting is carried out by minimizing the distances between the model and the data points. Traditional least square fitting assumes that the errors are normally distributed. A biological outlier can break this assumption and therefore have a strong influence on the fit. Because it contributes quadratically to the sum of least squares (χ^2).
In order to prevent such a strong contribution of the outliers to the function that needs to be minimized, a function that is less influenced by outliers is used.
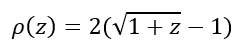
With z = χ2