Response Quality
The final step in assessing a ligand Dose Response Curve in DI.Screening Analysis software is to evaluate the Response Amplitude, resulting in the response quality check (see Quality Checks). The response values are obtained from the selected Response Evaluation Mode.
In single-dose screening all data points for a ligand have to show a consistent significant deviation from the references for the ligand to be considered a Hit. The minimum required Area Response is defined on the Data page of DI.Screening Analysis, either as a manual minimum or as a multiple of the global standard deviation over all references of the assay. In addition, no data point must deviate from the ligand average by more than 20 %, otherwise the Inhomogeneity Quality is set to negative.
In affinity screening a dose response curve is fitted to the response values by either the Kd Fit Model or the Hill Model.
- If the fit succeeds,
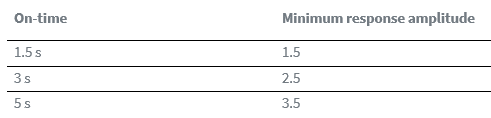
- the fitted response amplitude is larger than the response amplitude threshold in the table below,
- the signal-to-noise ratio is larger than 5, the baseline is clearly visible (gap between baseline and model value at lowest concentration must be less than 25 % of the response amplitude)
- and the saturation is reached (gap between saturation and model value at highest concentration must be less than 50 % of the response amplitude)
then the response quality is positive. If all other qualities are positive too, then this ligand is considered a Binder. If a level of saturation is reached between 25% and 50% and all other criteria are fulfilled, then the ligand is considered a Weak Binder. The following table shows the response amplitude threshold required for binders, depending on the measured/selected On-time:
The automatic setting of the quality can be overridden by the user as described in Quality Checks.