Ligand Category
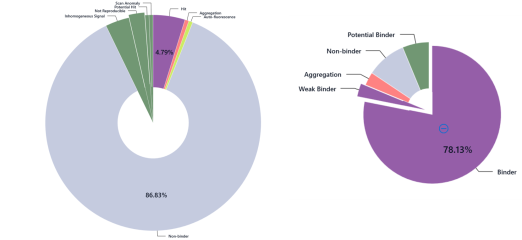
In DI.Screening Analysis software ligands are automatically assigned a category, depending on the data obtained for a particular ligand. The two main categories are Hits and Non-Binders that are assigned based on the Response Amplitude measured. However, data obtained by Dianthus instruments can contain other interesting information about a ligand. For example, if a ligand shows autofluorescence or induces target aggregation. Here are the ligand categories in Single-Dose Screening and Affinity Screening:
DI.Screening Analysis software shows a pie chart with the ligand categories on the summary page:
| Single-Dose Screening | |||
| Main Category | Sub-Category | Determining factor | Relevant Articles |
| Hit | Response Quality | ||
| Non-Binder | Response Quality | ||
| Aggregation | Aggregation Quality | TRIC-trace | |
| Auto-fluorescence | Fluorescence Quality | Initial Fluorescence | |
| Inconclusive | Scan Anomaly | Well-Scan Quality | Well Scans |
| Potential Hit | Fluorescence Quality | ||
| Not Reproducible | |||
| Inhomogenous Signal | Inhomogeneity Quality | Response Amplitude
Area Response |
|
| Affinity Screening | |||
| Main Category | Sub-Category | Determining factor | Relevant Articles |
| Binder | Binder | Response Quality | |
| Weak Binder | Response Quality | ||
| Non-Binder | Response Quality | ||
| Aggregation | Aggregation Quality | TRIC-trace | |
| Auto-fluorescence | Fluorescence Quality | ||
| Inconclusive | Scan Anomaly | Well-Scan Quality | Well Scans |
| Potential Hit | Fluorescence Quality | Quenching | |
DI.Screening Analysis software shows a pie-chart with the ligand categories on the summary page: